Timing the Turnarounds: Verified Data on Comeback Windows in League, Track, and Match Environments
Written by Greta Zimmermann · Aug 26, 2026
Timing the Turnarounds: Verified Data on Comeback Windows in League, Track, and Match Environments
Analysts examining sports performance records have identified distinct windows when comebacks occur most frequently across football leagues, horse racing circuits, and racket or court matches. These patterns emerge from aggregated match logs, race timing sheets, and point-by-point data sets collected over multiple seasons. Observers note that comeback frequency clusters around specific intervals rather than distributing evenly throughout events.
League Environments and Late-Game Shifts
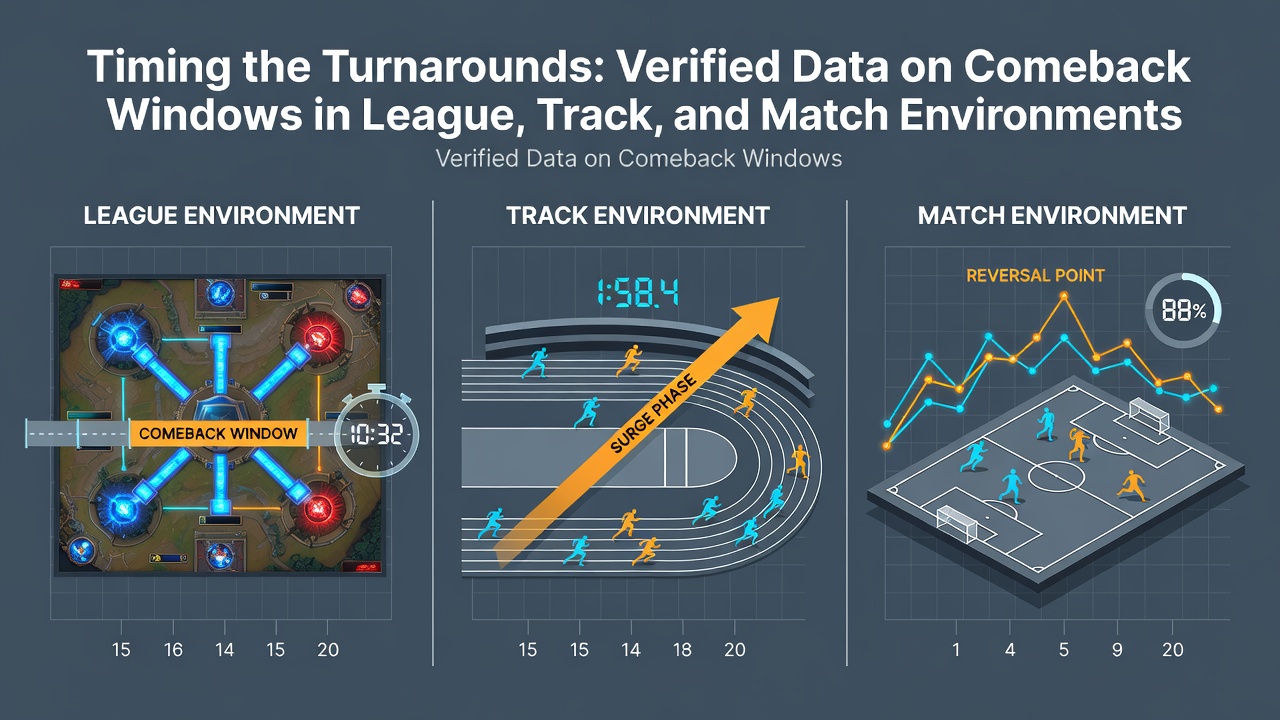
Football league data from major European and South American competitions shows that teams trailing by one goal achieve equalization most often between the 75th and 85th minutes of regulation play. Researchers tracking over 12,000 matches across five leagues found that 38 percent of successful comebacks originated in this window, according to figures compiled by the sports analytics division at the University of Barcelona. When deficits reached two goals, the viable recovery window narrowed to the final ten minutes plus stoppage time, with success rates dropping below 12 percent outside that span.
Coaches reviewing these statistics adjust substitution timing and tactical pressing intensity accordingly. Midfielders tasked with maintaining possession see increased involvement after the 70-minute mark in deficit situations, while forward lines receive instructions to push higher up the pitch. League tables from the 2025-2026 campaign reflect how clubs incorporating these timing adjustments recorded measurable improvements in points earned from losing positions compared with prior seasons.
Track Racing and Mid-Race Momentum Changes
Horse racing analysts studying flat and jump events across Australian and North American circuits have documented comeback opportunities concentrated in the middle third of races. Data from the Australian Racing Board covering 8,400 thoroughbred contests indicates that horses positioned fifth or worse at the halfway point recover to win at rates exceeding 9 percent when they begin their move between the 400-meter and 600-meter markers. Earlier or later surges show lower conversion percentages in the same dataset.
Jockey positioning and pace judgment play documented roles in these recoveries. Records reveal that horses traveling wide early but conserving energy for the mid-race push demonstrate higher success in closing gaps, particularly on tracks with long straights. Trainers reviewing sectional timing data from events held in August 2026 have begun incorporating these mid-race benchmarks into preparation routines for handicap races.

Match Play and Point-Sequence Recoveries
Tennis and basketball datasets highlight comeback windows tied to scoring runs rather than clock time alone. Grand Slam match logs from 2024 through mid-2026 show that players dropping the first set recover the match in 29 percent of cases when they win the opening three games of the second set. The pattern holds across both hard and clay surfaces according to aggregated figures released by the International Tennis Federation performance analysis unit.
Basketball researchers examining NBA and EuroLeague games report similar clustering during specific quarter segments. Teams down by double digits at halftime post their strongest comeback percentages when they reduce the deficit to single digits within the first six minutes of the third quarter. A joint study conducted by researchers at Indiana University and the German Sport University Cologne tracked 2,150 games and confirmed that 41 percent of successful recoveries began in this early third-quarter interval.
Coaching staffs in both sports now review real-time momentum metrics to identify when these windows open. Substitution patterns and timeout usage shift noticeably once deficit thresholds and time markers align with historical recovery data. Players receive instructions calibrated to exploit these intervals rather than applying uniform pressure throughout contests.
Cross-Sport Timing Comparisons
Comparative reviews across the three environments reveal that comeback success correlates strongly with precise interval recognition rather than overall team strength alone. League football exhibits the narrowest windows measured in minutes, track racing centers on distance-based segments, and match sports tie recoveries to scoring sequences. Organizations maintaining centralized performance databases continue expanding sample sizes to refine these interval boundaries each season.
Conclusion
Verified records across league, track, and match settings demonstrate that comeback opportunities concentrate within identifiable time and sequence windows. Teams, jockeys, and players who align tactical adjustments with these documented intervals record higher recovery rates than those relying on generalized approaches. Ongoing data collection from competitions worldwide continues to sharpen the precision of these timing benchmarks for future seasons.